Reading the benchmark 0.1 result
Interpretation, not new benchmark evidence
This page deterministically describes the already accepted m8-final-v0-1-002 artifacts.
Its build path reads only the seven hash-pinned CSV/NPZ files listed below. It does not load a
Track asset, create an Environment, run a Controller, or access Test again.
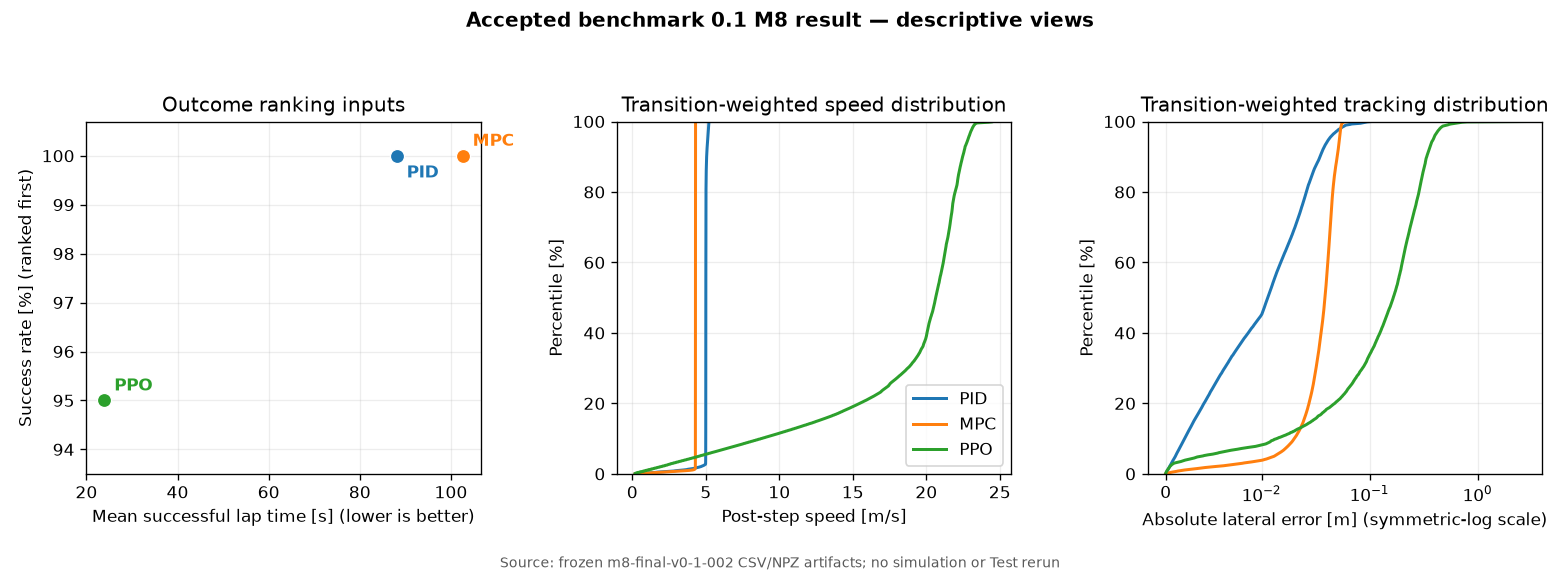
The benchmark ranks success rate first, then mean lap time over successful episodes. That rule is essential to reading the result: PPO recorded much shorter successful laps, but its 19/20 completion rate places it behind the two 20/20 Controllers.
| Rank | Controller | Success | Mean successful lap | Median successful lap | Mean speed | Lateral RMS | Compute P99 |
|---|---|---|---|---|---|---|---|
| 1 | PID | 20/20 | 88.085 s | 87.500 s | 4.974 m/s | 0.0211 m | 0.340 ms |
| 2 | MPC | 20/20 | 102.563 s | 101.900 s | 4.273 m/s | 0.0381 m | 43.902 ms |
| 3 | PPO | 19/20 | 23.913 s | 23.750 s | 18.324 m/s | 0.2205 m | 0.281 ms |
What the accepted samples show
- PID and MPC occupy the reliable, lower-speed end of this particular comparison. Both completed all 20 Tracks. PID was faster than MPC on every paired Track, by 14.478 s on average (paired median 14.400 s).
- PPO occupies the higher-speed, lower-tracking-margin end. Its mean successful lap time was 27.1% of PID's and its transition-weighted mean speed was 3.68 times PID's. It was faster on all 19 Tracks where both PPO and PID succeeded, and on all 19 shared successes with MPC.
- The speed came with a visibly wider tracking-error distribution. PPO's transition-weighted
lateral RMS was 10.5 times PID's. Its single unsuccessful episode was an
off_tracktermination on row 14, Track ID2000016; that episode is included in the transition distributions. - Runtime cost differs sharply by implementation. PID and exported NumPy PPO had sub-millisecond compute P99 values. MPC's P99 was 43.902 ms against the 50 ms diagnostic deadline, with 40 misses in 41,025 calls. Timing is hardware- and run-specific; it is not a general real-time guarantee.
These observations make the table useful for teaching: the ranking deliberately refuses to trade one failure for faster successful laps, while the auxiliary metrics expose the behavior hidden by rank alone. They do not show that PID is generally superior to reinforcement learning, that PPO is generally faster, or that these three points establish a controller-family Pareto frontier.
Scope and limitations
This is a descriptive comparison of three frozen example implementations and configurations on one fixed 20-Track benchmark set. It is not a matched-speed ablation, a causal study of algorithm families, or a confidence claim about a broader population. Transition distributions weight every recorded simulation step, so longer episodes contribute more samples. Lap-time summaries contain successful episodes only. Read the Evaluation Protocol for the exact metric, ranking, split, and attempt-lineage definitions.
No Controller or benchmark configuration was changed from this interpretation. Future Controller work must use Train and Validation; these accepted Test outcomes are reporting data, not tuning feedback.
Deterministic derivation
Regenerate the page and figure, then verify that the committed bytes are current:
pixi run build-result-analysis
pixi run check-result-analysis
The figure SHA-256 is 09224c06f5d844ca095b0c6de6ad8726ef16bbc7a7763f16d8961615b0ff9e33. The generator recomputes central success, lap-time, speed,
lateral-error, saturation, timing, Track-order, reset-seed, and episode-boundary claims from the
underlying rows and arrays before it writes anything.
| Frozen input | SHA-256 |
|---|---|
benchmarks/v0.1/m8_final_results.csv |
a6d5a7425d1c1091ba3111c722b607f9f60398d8e444e9943c80d27042de7a04 |
results/0.1/pid/m8-final-v0-1-002/results.csv |
bce37414510ef1f4c865c19fbc69e45a74c475b94137eda9c1f9a6ba3fa0f44d |
results/0.1/pid/m8-final-v0-1-002/metrics.npz |
5b09f33ffebf2268ae02dbbd43ac08daf8fded8fe3a7e294b6973eb363d31466 |
results/0.1/mpc/m8-final-v0-1-002/results.csv |
bd561a80f5eb7653361c5306fe67c9a240d99a23a718c0d0d2d450155a2d27ed |
results/0.1/mpc/m8-final-v0-1-002/metrics.npz |
fcb70ab25e5413abe3da7787a9677f06944532a17c9b4cfaa4fb2065c31286c8 |
results/0.1/ppo/m8-final-v0-1-002/results.csv |
9dad0feab09c7df1bba5bd627c3d02d81707f00fa4283f49e592637d671b7fd8 |
results/0.1/ppo/m8-final-v0-1-002/metrics.npz |
c1117be7dabbec489d468a288cbecbff6d99b3c238a28542f8d1940beadadd6f |